See the whole field, not a sample of it

Walking rows or relying on spot checks means most of a field goes unseen between visits. Solvi turns a single flight into plot-level maps you can act on.

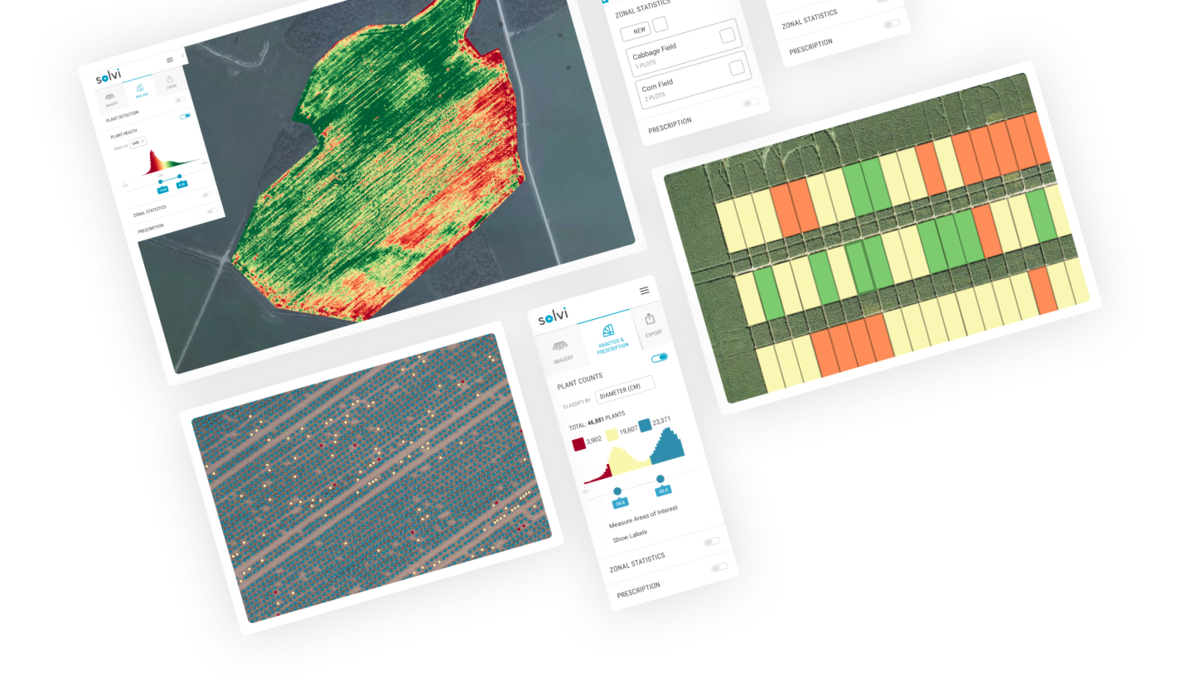
Solvi drone analytics dashboard showing crop health zones, plant counts, and plot statistics Solvi — plot-level analytics from a single flight
How it works — Solvi

One flight, full-block coverage

Collect imagery with any drone and camera — RGB or multispectral. Solvi processes it into accurate maps within 30–60 minutes, then lets you digitize plot boundaries and pull zonal statistics in a few clicks. PlantAI™ adds plant-level counts trained to your specific crop, from seedlings to mature fruit.

  • Full-block coverage instead of sampled rows, on a repeatable cycle
  • Plant counts and plant-level data via PlantAI™, tuned to your crop
  • Export to CSV/SHP or pull data via API for automated workflows
Why it earns its keep

Findings, not raw imagery

Solvi is built for researchers and agronomists managing field trials at scale — the same rigor applies whether you're running a few local blocks or thousands of trials worldwide.

Step 1

Fly it

Any drone, any camera — RGB or multispectral, whenever you need it.

Step 2

Process it

Imagery becomes accurate maps in 30–60 minutes, with plot boundaries digitized in a few clicks.

Step 3

Act on it

Compare plot performance over time, classify by any metric, export or pull via API.

Get started

See your own field mapped

Tell us what you're growing and how many blocks you're managing — we'll walk you through a real flight's worth of data.

Request a site assessment